Extend Metrics
When you need a metric that’s not present in the default list of node_exporter metrics you may be able to use the textfile collector.
The textfile collector allows exporting of statistics from batch jobs. It can also be used to export static metrics, such as what role a machine has.
Enable the textfile collector
The collector is enabled by default. The following folders are used for different resolutions:
| Resolution | Folder |
|---|---|
| High | /usr/local/percona/pmm2/collectors/textfile-collector/high-resolution |
| Medium | /usr/local/percona/pmm2/collectors/textfile-collector/medium-resolution |
| Low | /usr/local/percona/pmm2/collectors/textfile-collector/low-resolution |

The exporter parses all files in these directories that match the filename wildcard expression *.prom using a simple text-based exposition format.
Metrics are stored on the PMM Server-side with additional labels related to this Node.
Examples of shell commands for custom metrics
To statically set roles for a machine using labels:
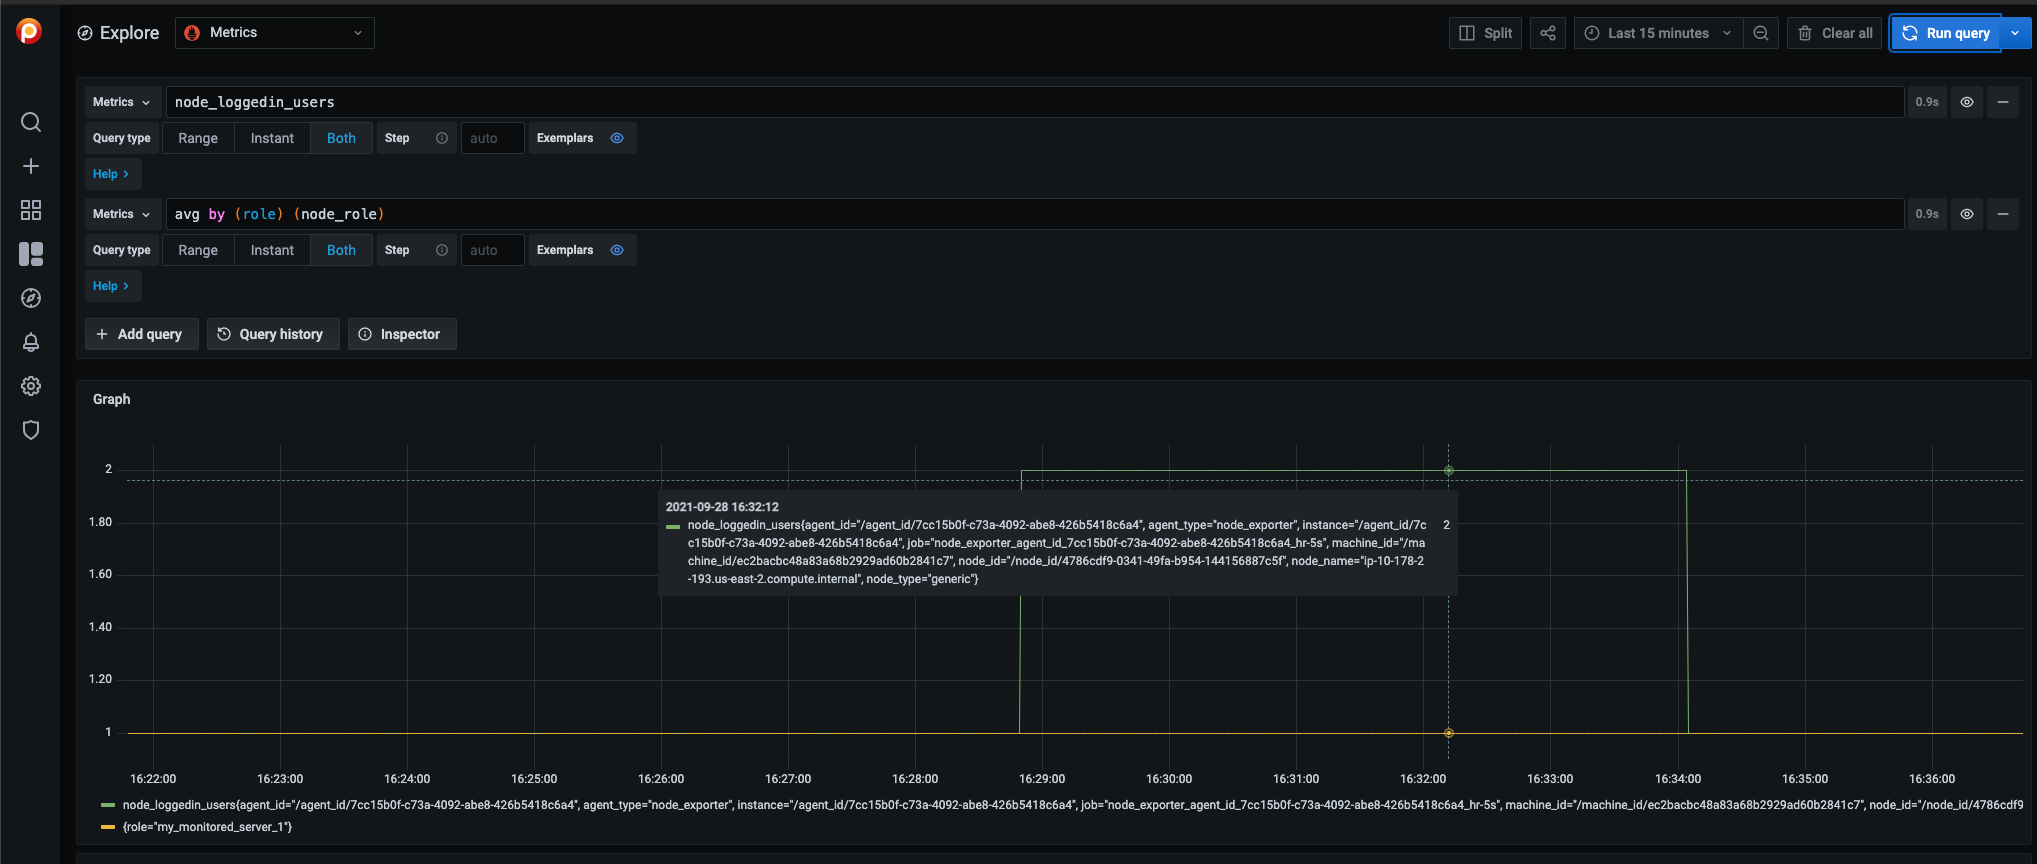
echo 'node_role{role="my_monitored_server_1"} 1' > /usr/local/percona/pmm2/collectors/textfile-collector/low-resolution/node_role.prom
Here’s an example of a cron job that automatically pushes logged-in users:
$ cat /etc/cron.d/loggedin_users
*/1 * * * *     root    /usr/bin/who | /usr/bin/wc -l | sed -ne 's/^/node_loggedin_users /p' > /usr/local/percona/pmm2/collectors/textfile-collector/high-resolution/node_users.prom

Get expert help
If you need assistance, visit the community forum for comprehensive and free database knowledge, or contact our Percona Database Experts for professional support and services.