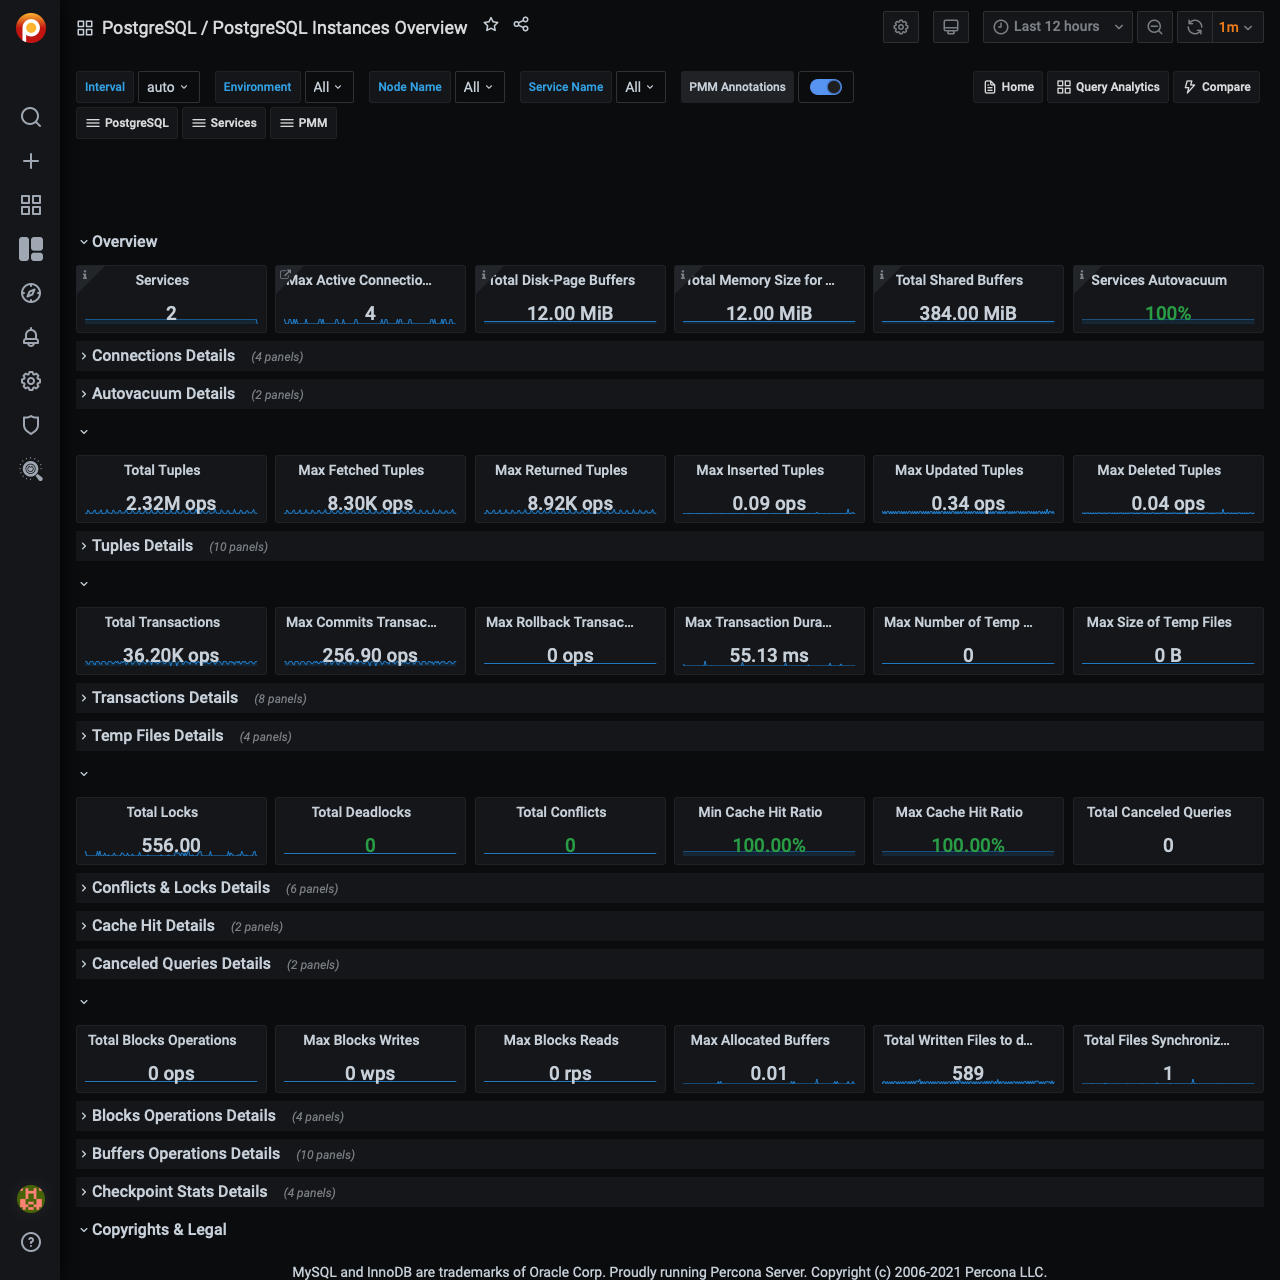
PostgreSQL Instances Overview

Connected
Reports whether PMM Server can connect to the PostgreSQL instance.
Version
The version of the PostgreSQL instance.
Shared Buffers
Defines the amount of memory the database server uses for shared memory buffers. Default is 128MB. Guidance on tuning is 25% of RAM, but generally doesn’t exceed 40%.
Disk-Page Buffers
The setting wal_buffers defines how much memory is used for caching the write-ahead log entries. Generally this value is small (3% of shared_buffers value), but it may need to be modified for heavily loaded servers.
Memory Size for each Sort
The parameter work_mem defines the amount of memory assigned for internal sort operations and hash tables before writing to temporary disk files. The default is 4MB.
Disk Cache Size
PostgreSQL’s effective_cache_size variable tunes how much RAM you expect to be available for disk caching. Generally adding Linux free+cached will give you a good idea. This value is used by the query planner whether plans will fit in memory, and when defined too low, can lead to some plans rejecting certain indexes.
Autovacuum
Whether autovacuum process is enabled or not. Generally the solution is to vacuum more often, not less.
PostgreSQL Connections
- Max Connections
- The maximum number of client connections allowed. Change this value with care as there are some memory resources that are allocated on a per-client basis, so setting
max_connectionshigher will generally increase overall PostgreSQL memory usage. - Connections
- The number of connection attempts (successful or not) to the PostgreSQL server.
- Active Connections
- The number of open connections to the PostgreSQL server.
PostgreSQL Tuples
- Tuples
- The total number of rows processed by PostgreSQL server: fetched, returned, inserted, updated, and deleted.
- Read Tuple Activity
- The number of rows read from the database: as returned so fetched ones.
- Tuples Changed per 5 min
- The number of rows changed in the last 5 minutes: inserted, updated, and deleted ones.
PostgreSQL Transactions
- Transactions
- The total number of transactions that have been either been committed or rolled back.
- Duration of Transactions
- Maximum duration in seconds any active transaction has been running.
Temp Files
- Number of Temp Files
- The number of temporary files created by queries.
- Size of Temp files
- The total amount of data written to temporary files by queries in bytes.
All temporary files are taken into account by these two gauges, regardless of why the temporary file was created (e.g., sorting or hashing), and regardless of the log_temp_files setting.
Conflicts and Locks
- Conflicts/Deadlocks
- The number of queries canceled due to conflicts with recovery in the database (due to dropped tablespaces, lock timeouts, old snapshots, pinned buffers, or deadlocks).
- Number of Locks
- The number of deadlocks detected by PostgreSQL.
Buffers and Blocks Operations
- Operations with Blocks
- The time spent reading and writing data file blocks by back ends, in milliseconds.
Tip
Capturing read and write time statistics is possible only if track_io_timing setting is enabled. This can be done either in configuration file or with the following query executed on the running system:
ALTER SYSTEM SET track_io_timing=ON;
SELECT pg_reload_conf();
- Buffers
- The number of buffers allocated by PostgreSQL.
Canceled Queries
The number of queries that have been canceled due to dropped tablespaces, lock timeouts, old snapshots, pinned buffers, and deadlocks.
Data shown by this gauge are based on the pg_stat_database_conflicts view.
Cache Hit Ratio
The number of times disk blocks were found already in the buffer cache, so that a read was not necessary.
This only includes hits in the PostgreSQL buffer cache, not the operating system’s file system cache.
Checkpoint Stats
The total amount of time that has been spent in the portion of checkpoint processing where files are either written or synchronized to disk, in milliseconds.
PostgreSQL Settings
The list of all settings of the PostgreSQL server.
System Summary
This section contains the following system parameters of the PostgreSQL server: CPU Usage, CPU Saturation and Max Core Usage, Disk I/O Activity, and Network Traffic.
Get expert help
If you need assistance, visit the community forum for comprehensive and free database knowledge, or contact our Percona Database Experts for professional support and services.