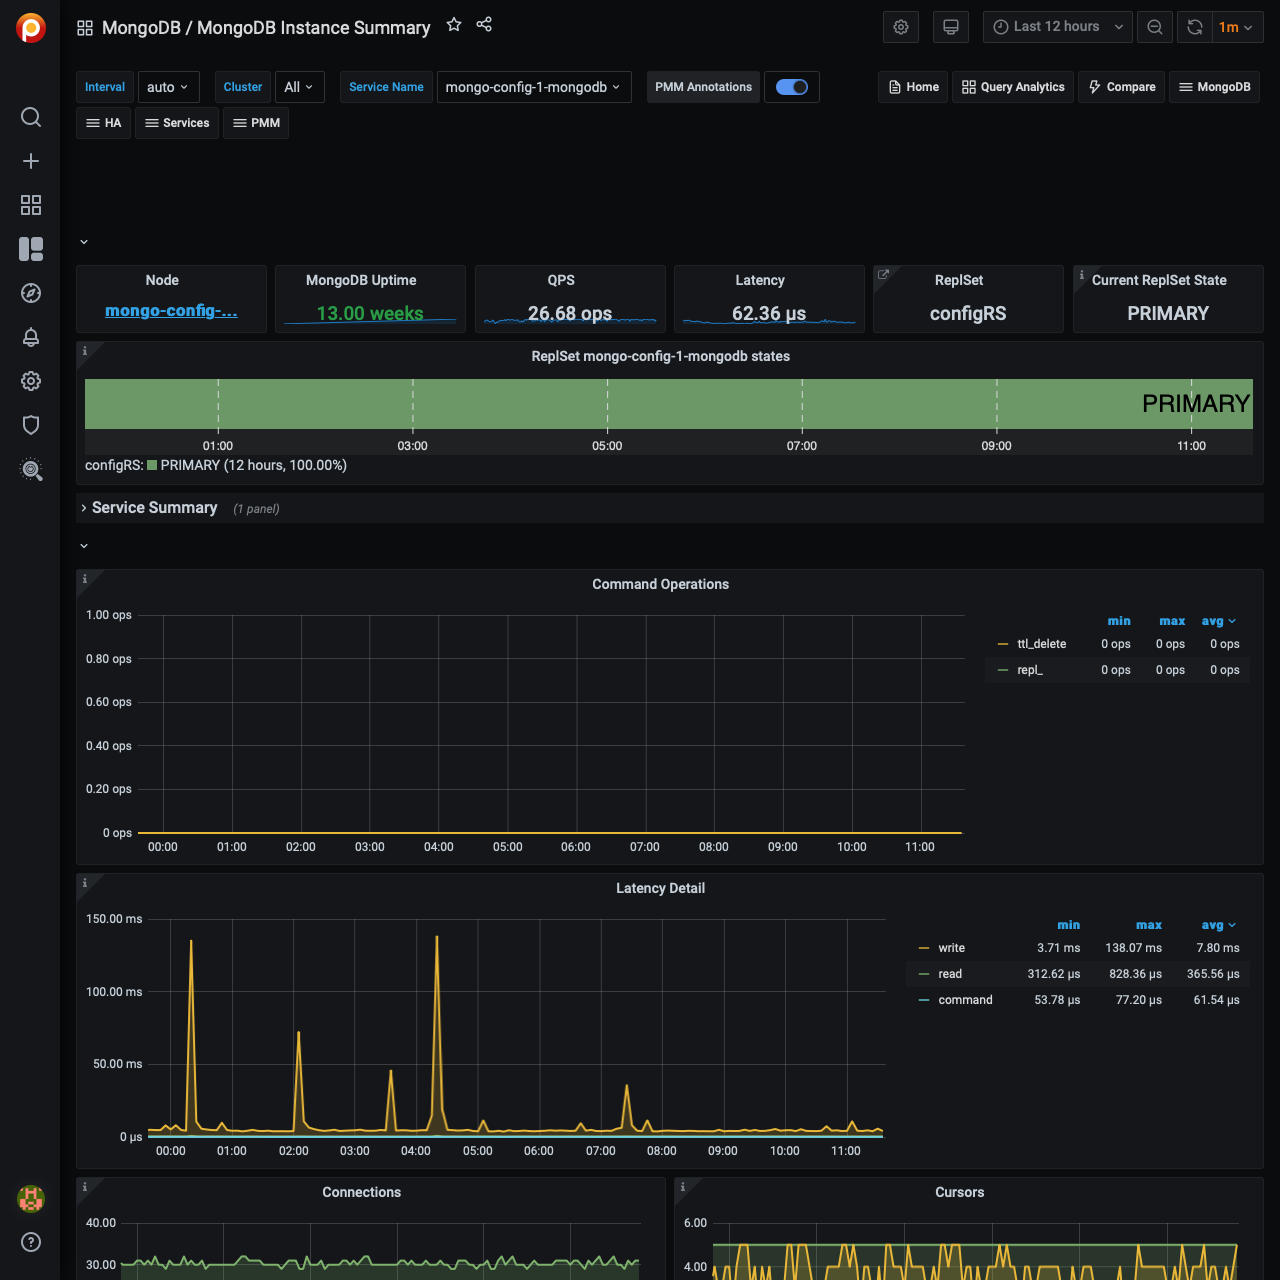
MongoDB Instance Summary

Command Operations
Ops or Replicated Ops/sec classified by legacy wire protocol type (query, insert, update, delete, getmore). And (from the internal TTL threads) the docs deletes/sec by TTL indexes.
Latency Detail
Average latency of operations (classified by read, write, or (other) command)
Connections
TCP connections (Incoming)
Cursors
Open cursors. Includes idle cursors.
Document Operations
Docs per second inserted, updated, deleted or returned. (not 1-to-1 with operation counts.)
Queued Operations
Operations queued due to a lock.
Query Efficiency
Ratio of Documents returned or Index entries scanned / full documents scanned
Scanned and Moved Objects
This panel shows the number of objects (both data (scanned_objects) and index (scanned)) as well as the number of documents that were moved to a new location due to the size of the document growing. Moved documents only apply to the MMAPv1 storage engine.
getLastError Write Time
Legacy driver operation: Number of, and Sum of time spent, per second executing getLastError commands to confirm write concern.
getLastError Write Operations
Legacy driver operation: Number of getLastError commands that timed out trying to confirm write concern.
Assert Events
This panel shows the number of assert events per second on average over the given time period. In most cases assertions are trivial, but you would want to check your log files if this counter spikes or is consistently high.
Page Faults
Unix or Window memory page faults. Not necessarily from MongoDB.
Get expert help
If you need assistance, visit the community forum for comprehensive and free database knowledge, or contact our Percona Database Experts for professional support and services.