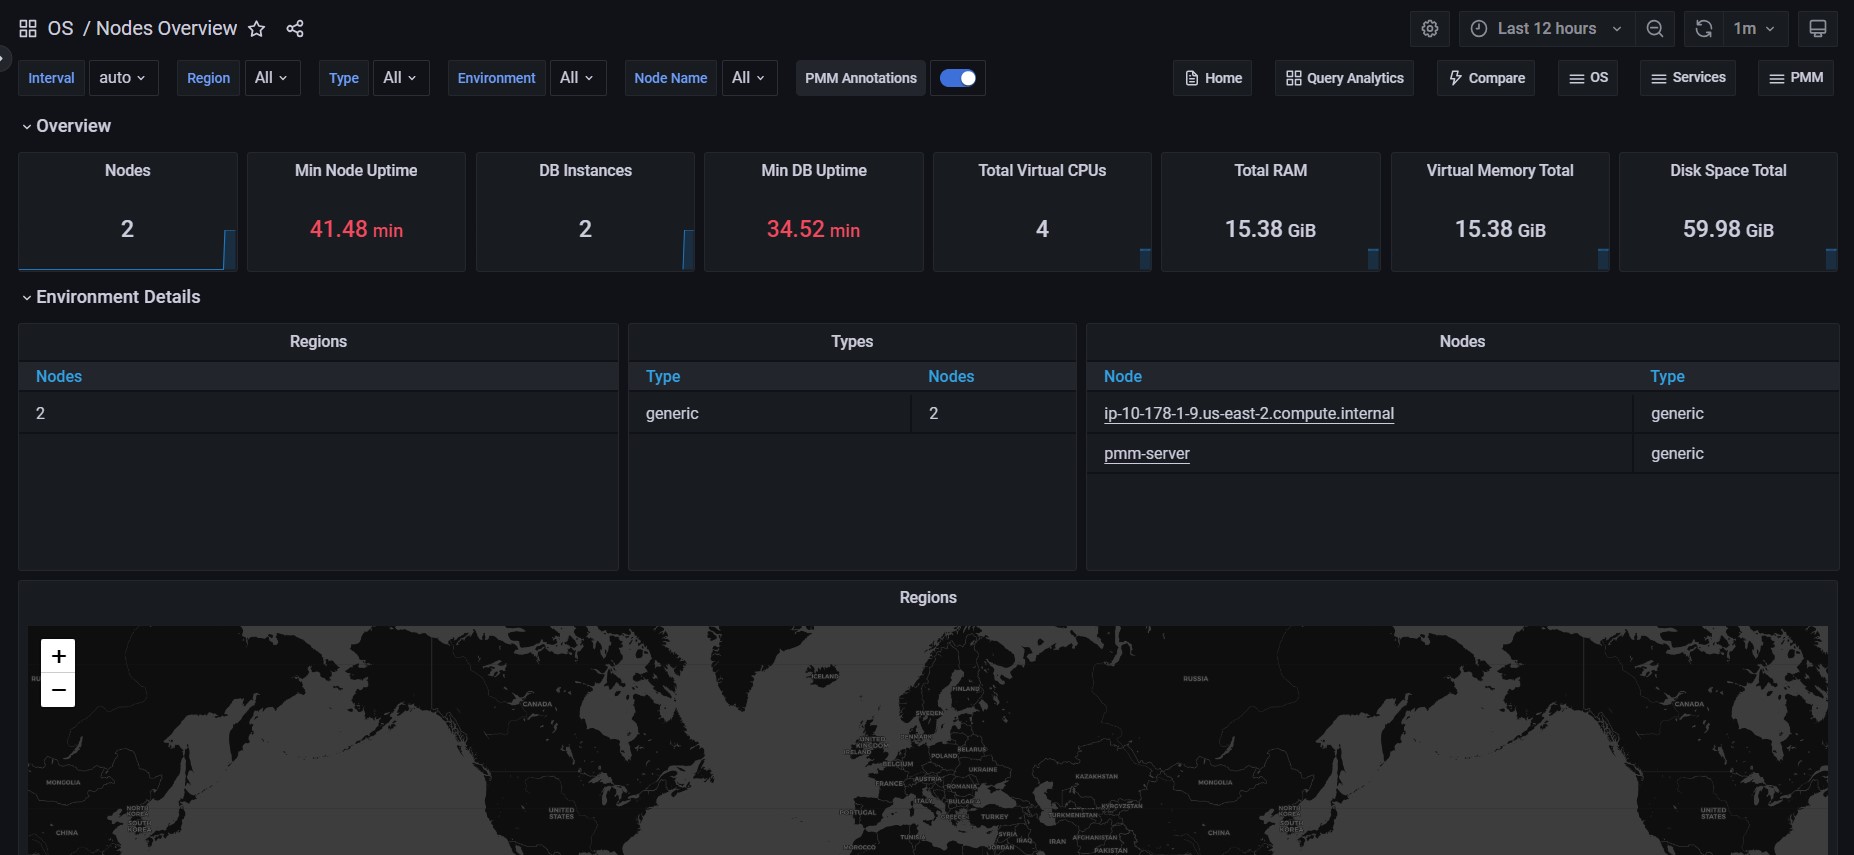
Nodes Overview

The Nodes Overview dashboard provides details about the efficiency of work of the following components. Each component is represented as a section in the dashboard.
- CPU
- Memory & Swap
- Disk
- Network
The CPU section offers the CPU Usage, CPU Saturation and Max Core Usage, Interrupts and Context Switches, and Processes metrics.
In the Memory section, you can find the Memory Utilization, Virtual Memory Utilization, Swap Space, and Swap Activity metrics.
The Disk section contains the I/O Activity, Global File Descriptors Usage, Disk IO Latency, and Disk IO Load metrics.
In the Network section, you can find the Network Traffic, Network Utilization Hourly, Local Network Errors, and TCP Retransmission metrics.
Get expert help
If you need assistance, visit the community forum for comprehensive and free database knowledge, or contact our Percona Database Experts for professional support and services.