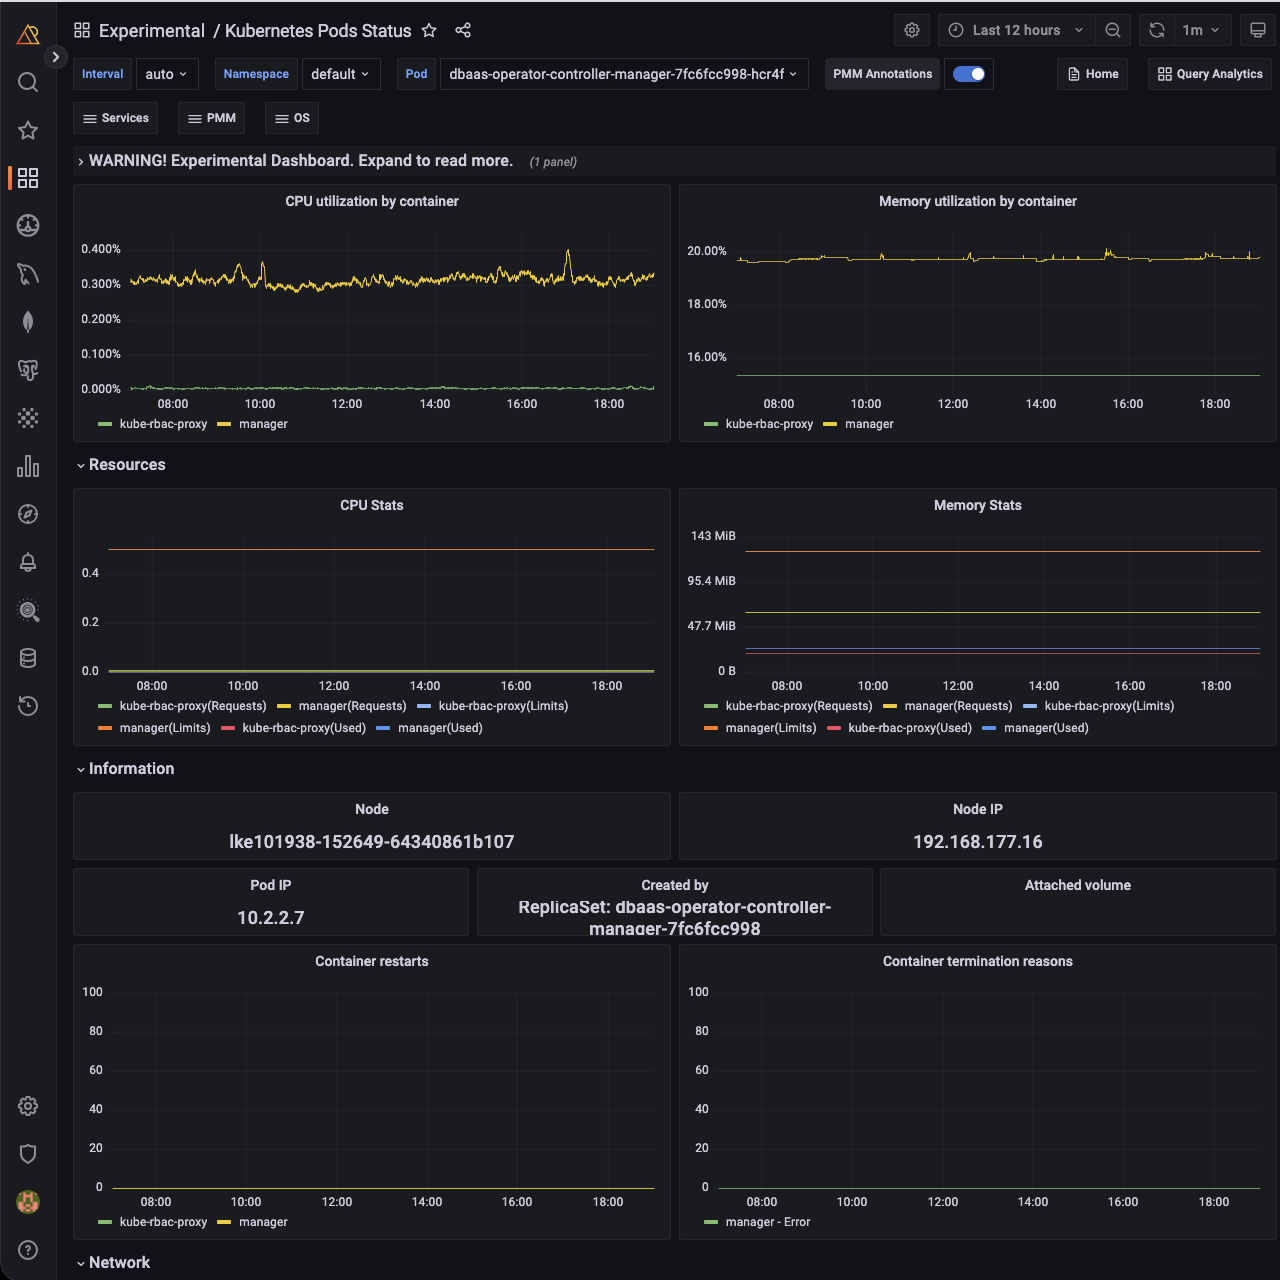
Kubernetes Pods Status
Disclaimer
This is an Experimental Dashboard that is not part of the official Percona Monitoring and Management (PMM) deployment and might be updated. We ship this Dashboard to obtain feedback from our users.
Availability
This experimental dashboard is available starting with PMM 2.37.0.

Kubernetes Pods Status dashboard provides detailed information about the state and performance of your pods, including CPU, Memory, and Network metrics.
This dashboard can help you quickly pinpoint any issues affecting your pods and ensure they continue to operate smoothly.
Get expert help
If you need assistance, visit the community forum for comprehensive and free database knowledge, or contact our Percona Database Experts for professional support and services.